IT service desk staffing is one of the most common — and most expensive — problems IT managers face in 2026. Too few analysts and SLAs slip, backlogs grow, and staff burn out. Too many and leadership questions the budget. This guide walks you through how to calculate the right headcount, identify the signals that your current model is broken, and build a staffing structure that scales without waste.
Why Most Service Desks Are Staffed Wrong
Most staffing decisions are made once — during a budget cycle — and then left alone until something breaks. The result is a team that was sized for last year's ticket volume, last year's technology, and last year's business structure.
Common reasons service desks end up over- or under-staffed include:
- Headcount approved based on gut feel rather than ticket data
- No adjustment when self-service adoption changes inbound volume
- Mergers, acquisitions or new business units that add users without adding analysts
- Automation initiatives that reduce volume but staffing levels stay the same
- Seasonal spikes treated as the baseline rather than as peaks
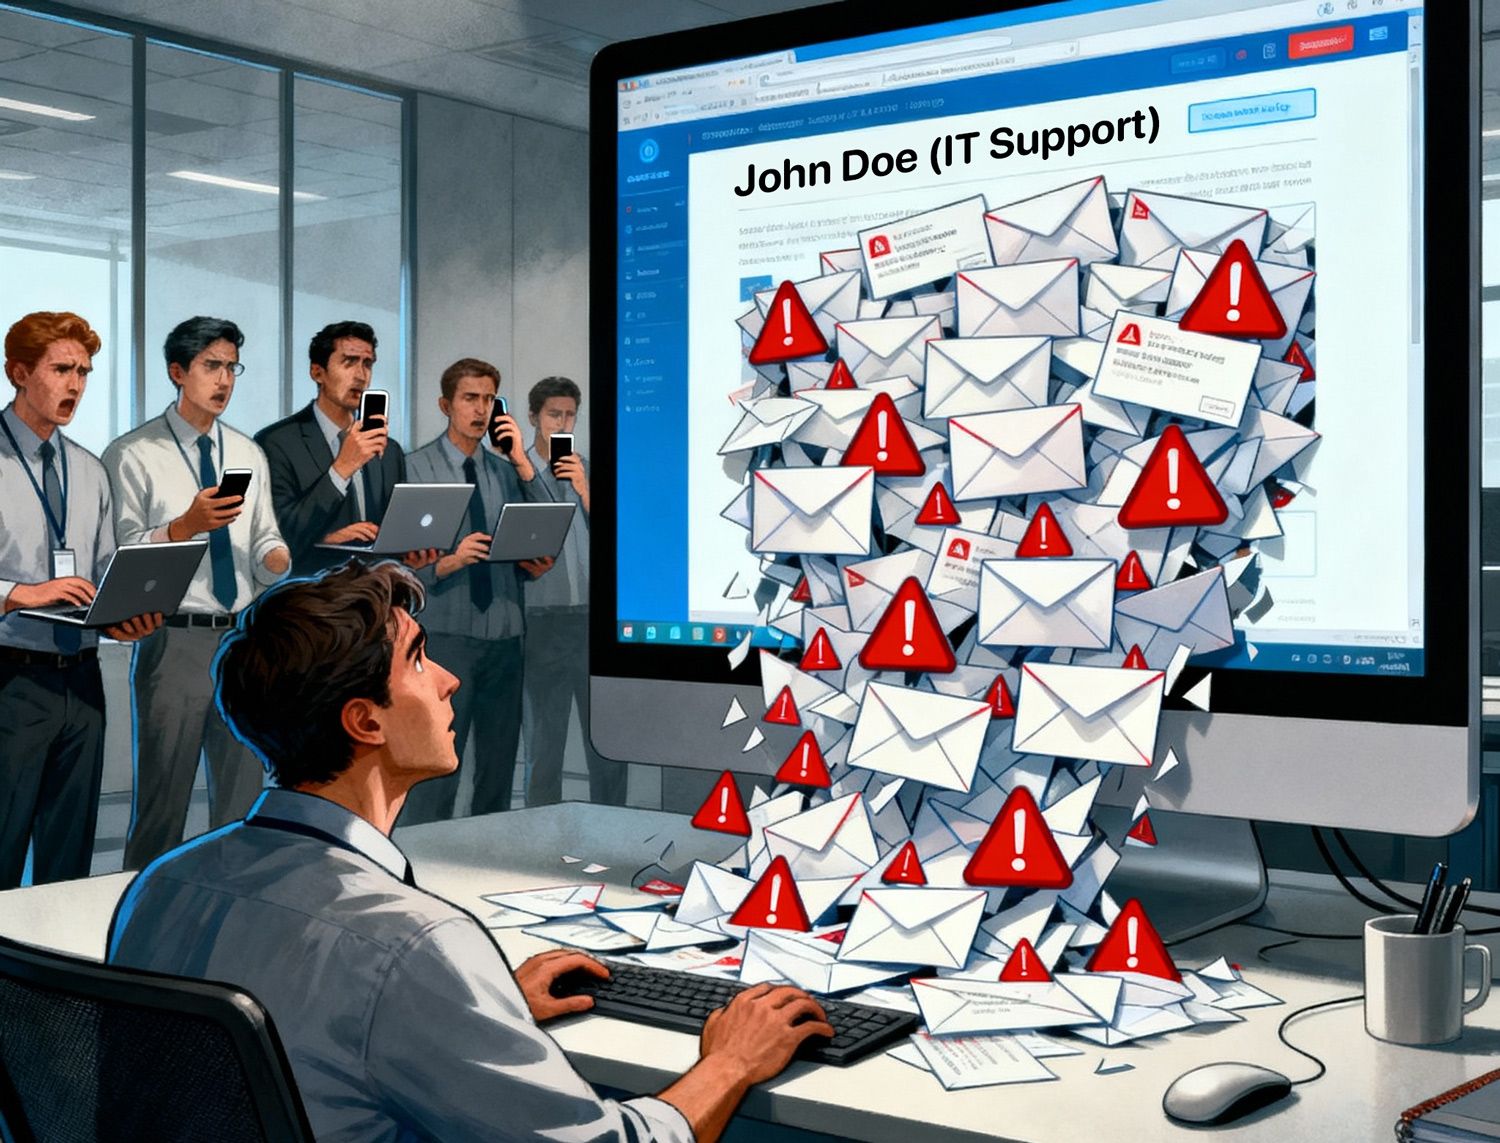
The cost of getting this wrong runs in both directions. Under-staffing drives up mean time to resolve and erodes end-user trust. Over-staffing inflates cost per ticket and makes it harder to justify the service desk budget to the CFO.
Getting staffing right is not a one-time exercise. It is a continuous process tied to your service data.
The Metrics That Drive Staffing Decisions

Before you can right-size your team, you need to know what your current team is actually doing. The following metrics form the foundation of any honest staffing analysis.
Ticket volume and arrival rate
How many tickets arrive per day, per week, and per month? Break this down by channel — email, portal, phone, chat — and by category. A team handling 400 tickets a week across two analysts looks very different from one handling 400 tickets a week where 60 percent are complex infrastructure requests.
Handle time per ticket type
Average handle time (AHT) is the single most important input to a staffing model. If your analysts spend an average of 18 minutes resolving a password reset and 90 minutes on a software installation, lumping both into a single "tickets per analyst per day" figure will mislead you.
Segment AHT by:
- Tier 1 vs. Tier 2 vs. Tier 3
- Category (hardware, software, access, network)
- Channel (phone tickets typically take longer than portal tickets)
Utilisation and occupancy
Utilisation measures what percentage of an analyst's paid time is spent on ticket work. Most experts recommend targeting 70–80 percent utilisation for a sustainable service desk — anything higher leaves no room for training, documentation, or unexpected spikes.
Occupancy measures the percentage of logged-in time spent handling tickets. High occupancy without breaks leads to errors and attrition.
First contact resolution rate
A low first contact resolution rate often signals a training or tooling problem rather than a headcount problem. Hiring more analysts to handle tickets that should be resolved at Tier 1 is an expensive mistake.
How to Calculate the Headcount You Actually Need

There is a straightforward formula that most workforce management practitioners use as a starting point. It is not a substitute for professional workforce planning software, but it gives you a defensible number to bring to a budget conversation.
Step 1 — Determine your weekly ticket volume.
Take a rolling 13-week average to smooth out spikes and seasonal dips.
Step 2 — Calculate weighted average handle time.
Multiply each ticket category's volume by its AHT, sum the results, and divide by total volume. This gives you one number that reflects the real complexity of your workload.
Step 3 — Calculate total handle time per week.
Multiply weekly ticket volume by weighted AHT. Convert to hours.
Step 4 — Adjust for utilisation.
Divide total handle time by your target utilisation rate (e.g. 0.75 for 75 percent). This gives you the total analyst hours you need.
Step 5 — Convert to headcount.
Divide total required hours by the number of productive hours one analyst delivers per week after accounting for meetings, training, and leave. Most organisations use 30–32 productive hours per week as a realistic figure for a full-time analyst.
Step 6 — Add cover for shifts and absence.
If you run an extended-hours or 24/7 desk, multiply your base headcount by a shift coverage factor. Add an absence factor (typically 15–20 percent) to account for planned and unplanned leave.
The result is your minimum viable headcount. Build in a buffer — usually one additional analyst per five — to absorb unexpected volume surges without breaching SLAs.
Structuring Your Team for Efficiency

Headcount is only part of the answer. How you structure that headcount determines whether your analysts are working on the right problems.
The tiered model and where it still makes sense
A classic Tier 1 / Tier 2 / Tier 3 structure works well for organisations with high volume and clear category boundaries. Tier 1 handles resets, account unlocks, and standard requests. Tier 2 handles application and hardware issues. Tier 3 escalates to vendors or specialist engineers.
The risk is that rigid tiers create unnecessary handoffs and inflate resolution time. A shift-left strategy — moving resolution capability down to Tier 1 through better tooling, knowledge, and automation — reduces the need for a large Tier 2 pool.
Specialist vs. generalist balance
High-volume desks benefit from generalists at Tier 1 and specialists at Tier 2. Low-volume desks with complex environments often do better with a smaller team of senior generalists who can handle most tickets end-to-end.
Remote and hybrid staffing considerations
Distributed teams add scheduling complexity but also open access to talent pools outside your local market. The key is ensuring that remote analysts have the same access to tools, knowledge, and escalation paths as on-site staff. Platforms like TIKTING give distributed teams a single pane of glass for ticket management, approvals, and asset data — reducing the coordination overhead that often inflates handle time on remote teams.
Signals That Your Staffing Model Needs a Review

You do not need to wait for a budget cycle to spot a staffing problem. These are the operational signals that should trigger a staffing review:
- SLA breach rate rising over two consecutive months
- Ticket backlog growing week-on-week without a clear cause
- Analyst overtime becoming routine rather than exceptional
- End-user satisfaction scores dropping without a change in ticket complexity
- First contact resolution rate falling while ticket volume stays flat
- New business units or locations added without a corresponding headcount review
On the over-staffing side, watch for:
- Analyst utilisation consistently below 55 percent
- Ticket handle times growing without a corresponding increase in complexity
- High ticket reassignment rates suggesting analysts are passing work to avoid idle time
Connecting your staffing data to a live service management platform makes these signals visible before they become crises. Odysseus asset discovery data can also help here — when the number of managed endpoints grows faster than your ticket volume, it often signals that self-service or automation is absorbing demand that would otherwise hit the desk.
A Staffing Review Checklist for IT Managers

Run through this checklist quarterly or whenever a significant organisational change occurs.
- Pull 13 weeks of ticket volume data, segmented by category and channel
- Calculate weighted average handle time for each tier
- Measure current analyst utilisation and occupancy rates
- Review first contact resolution rate by category
- Check SLA performance trend over the review period
- Identify the top five ticket categories by volume and assess automation potential
- Review shift coverage against actual arrival rate by hour and day
- Confirm headcount accounts for planned leave, training days, and public holidays
- Assess whether any Tier 2 or Tier 3 categories could be shifted left with knowledge base investment
- Document findings and present a headcount recommendation with supporting data
Frequently Asked Questions
What is the right ratio of service desk analysts to end users?
There is no universal ratio, but a commonly cited starting point is one analyst per 50–100 end users for a standard business environment. The right number depends heavily on ticket volume, complexity, self-service adoption, and the maturity of your automation and knowledge management practices. Always base your ratio on actual ticket data rather than industry benchmarks alone.
How often should you review service desk staffing levels?
Most IT managers review staffing quarterly, with a deeper annual review tied to the budget cycle. You should also trigger an unscheduled review whenever ticket volume changes by more than 15 percent, a major organisational change occurs, or SLA performance drops for two consecutive months.
What is the difference between utilisation and occupancy on a service desk?
Utilisation measures the percentage of total paid time an analyst spends on productive ticket work. Occupancy measures the percentage of logged-in time spent actively handling tickets. Both matter: high utilisation with low occupancy suggests scheduling inefficiency, while high occupancy with low utilisation suggests analysts are logged in for fewer hours than planned.
Who owns service desk staffing decisions?
Typically the IT service desk manager owns day-to-day scheduling and shift planning, while the IT director or CIO owns headcount budget decisions. In larger organisations, a workforce management function may sit between the two. The service desk manager should own the data and the recommendation; leadership owns the approval.
Can automation reduce the headcount I need?
Yes, but the effect is often smaller and slower than vendors suggest. Automation reduces handle time on repetitive, high-volume categories — password resets, account unlocks, standard software requests. It rarely eliminates the need for human analysts on complex or sensitive issues. A realistic expectation is a 10–25 percent reduction in Tier 1 volume for a well-implemented automation programme.
How do you justify a headcount increase to leadership?
Build the case on data: ticket volume trend, SLA breach rate, analyst utilisation, and the cost of breaches versus the cost of an additional analyst. Show the business impact — not just the IT impact — of under-staffing, including end-user productivity loss and risk to service continuity. A clear staffing model with documented assumptions is far more persuasive than a headcount request without supporting analysis.
Key Takeaways
- Staffing decisions made without current ticket data are almost always wrong
- Weighted average handle time, utilisation, and first contact resolution are the three metrics that matter most for staffing analysis
- The right headcount formula accounts for ticket volume, handle time, utilisation targets, shift coverage, and absence
- Staffing reviews should happen quarterly, not just at budget time
- Structure matters as much as headcount — a shift-left strategy can reduce Tier 2 demand without adding analysts
- Operational signals like rising SLA breach rates and growing backlogs should trigger a review before the next budget cycle
TIKTING gives service desk managers the reporting and workflow visibility they need to run this analysis on live data rather than spreadsheet estimates. Combined with Odysseus endpoint discovery, you get a clear picture of how your managed environment is growing relative to your team's capacity — so staffing decisions are grounded in reality, not guesswork.