IT event management is the practice of monitoring, filtering, and acting on every signal your infrastructure generates — and most teams are drowning in alerts before they ever catch the ones that count. This guide explains what event management is, why it sits at the heart of proactive IT operations, and how to build a process that turns raw monitoring noise into meaningful action.
What IT Event Management Actually Means
Event management is an ITIL v4 practice focused on detecting and making sense of events — any change of state that is significant to the management of a service or configuration item. That definition is deliberately broad.
An event can be:
- A server CPU crossing 90% utilisation
- A backup job completing successfully
- A network switch losing a link
- A certificate approaching its expiry date
- A user logging in outside business hours
Not every event is a problem. Some are purely informational. Others are warnings that need watching. A small number require immediate action. The entire discipline of event management is about telling those three apart quickly and consistently.
How Event Management Differs from Incident Management
Incident management starts when something has already broken and a user is affected. Event management starts earlier — it watches infrastructure continuously and can trigger an incident before any user notices a degradation. Done well, event management feeds incident management, change management, and capacity management with early signals rather than crisis reports.
The Three Event Categories
Most frameworks recognise three types:
- Informational: normal operations, no action needed, logged for audit or trend analysis
- Warning: something is approaching a threshold and may need attention soon
- Exception: a threshold has been breached or a failure has occurred, requiring immediate action
Getting your categorisation right is the first filter. Misclassifying warnings as exceptions floods your team with false urgency. Misclassifying exceptions as informational means real failures go unnoticed.
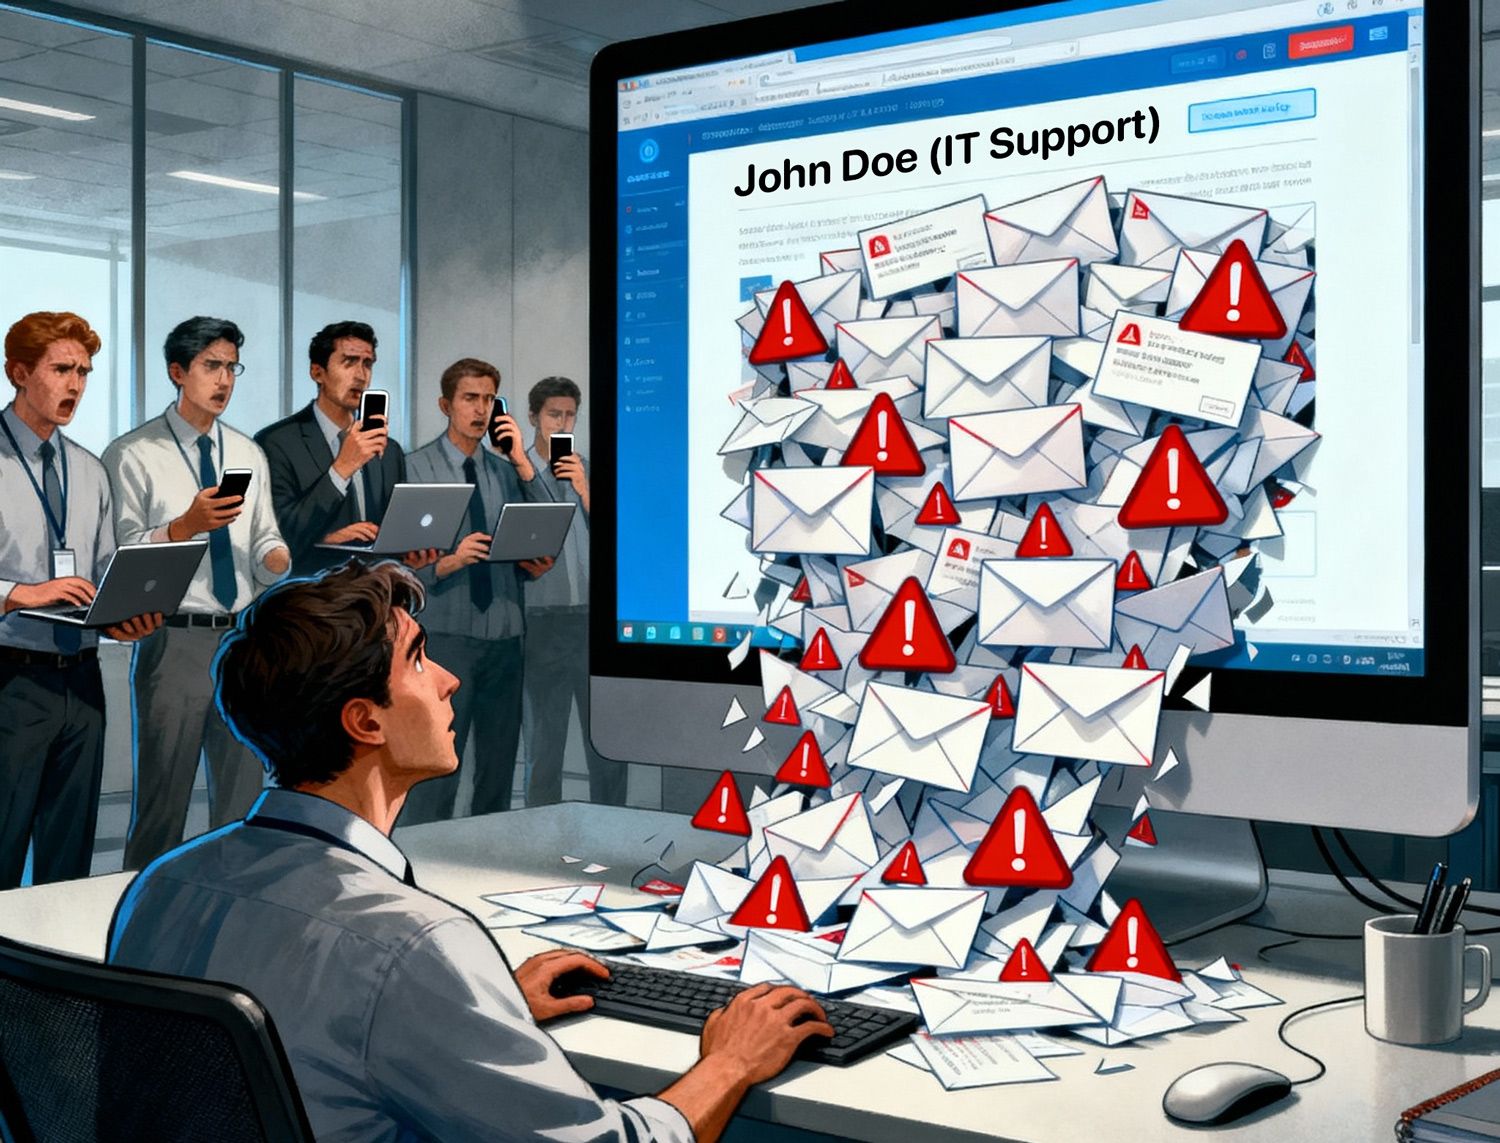
Why Most Teams Struggle With Alert Fatigue

Alert fatigue is one of the most common and damaging problems in IT operations. When monitoring tools generate hundreds or thousands of alerts per day, engineers start tuning them out. Critical notifications get buried. On-call engineers become desensitised. Response times slow down precisely when speed matters most.
The root causes are usually the same across organisations:
- Monitoring thresholds set too low or never tuned after initial deployment
- Duplicate alerts from multiple tools covering the same infrastructure
- No clear ownership of who acts on which alert category
- Alerts that fire without enough context to diagnose the cause
- No suppression logic during known maintenance windows
The result is a team that is technically monitoring everything but effectively watching nothing. Fixing alert fatigue is not about buying more monitoring tools — it is about designing a deliberate filtering and routing process.
The Cost of Getting It Wrong
Missed or delayed event response compounds quickly. A warning-level disk space alert ignored for a week becomes a full-disk exception that causes a service outage. That outage becomes a major incident. The major incident triggers a problem investigation. All of that cost traces back to an unactioned warning event. Most experts agree that proactive event management consistently reduces the volume and severity of incidents over time.
Building an Event Management Process That Works

A functional event management process has five stages. Each one needs an owner, a tool, and a defined output.
Stage 1 — Define What to Monitor
Start with your service catalogue and CMDB. Every service has supporting configuration items: servers, network devices, databases, certificates, applications. For each CI, define which metrics matter and what normal looks like. Monitoring everything at the same granularity is a fast path to noise. Prioritise CIs that underpin your highest-priority services.
Stage 2 — Set Meaningful Thresholds
Thresholds should reflect real risk, not theoretical maximums. A CPU at 95% for two seconds during a batch job is normal. A CPU at 85% sustained for fifteen minutes on a transactional database is a warning worth acting on. Build thresholds from observed baselines, not vendor defaults. Review them quarterly as workloads change.
Stage 3 — Filter and Correlate
Raw monitoring output needs a filtering layer before it reaches a human. This is where event correlation rules earn their value. Correlation logic can:
- Suppress child alerts when a parent infrastructure failure already explains them
- Group related alerts into a single notification
- Suppress alerts during approved change windows
- Escalate a warning to an exception if it persists beyond a defined duration
Many ITSM platforms and monitoring tools support correlation rules natively. If yours does not, even a simple triage checklist applied by a first-line analyst adds meaningful noise reduction.
Stage 4 — Route to the Right Response
Once an event passes filtering, it needs a destination. Informational events should go to a log store, not a human inbox. Warning events should create a task or watchlist item for the relevant team. Exception events should auto-raise an incident ticket with enough context attached — affected CI, metric value, threshold breached, time of first occurrence — for the assignee to begin diagnosis without hunting for data.
Routing rules should be documented, version-controlled, and reviewed whenever your service portfolio changes.
Stage 5 — Close the Loop
Every exception event that raised an incident should be reviewed after resolution. Did the alert fire at the right threshold? Did the routing get it to the right team? Was the context sufficient? Feeding that review back into your monitoring configuration is how the process improves over time. This is the connection between event management and the continual improvement practice.
Integrating Event Management With Your ITSM Platform

Event management only delivers its full value when it is connected to the rest of your ITSM processes. An alert that fires in a monitoring tool but never creates a ticket, updates a CI, or triggers a change record is an orphan — it happened, but the organisation cannot learn from it or track its resolution.
The integrations that matter most are:
- Monitoring tool to ITSM: auto-create incident records from exception events, including CI reference, severity, and alert detail
- CMDB to monitoring: ensure every monitored CI is registered and that monitoring coverage gaps are visible
- Change management to monitoring: suppress or contextualise alerts during approved maintenance windows so engineers are not chasing false positives during planned work
- Problem management to event history: use event logs to identify recurring patterns that warrant a formal problem investigation
When your CMDB is accurate and your monitoring is aligned to it, you can see at a glance which services are affected by an event, who owns them, and what dependencies might be at risk. Without that alignment, every exception event starts a manual investigation from scratch.
What to Look for in Tooling
When evaluating whether your current ITSM platform supports event management well, look for:
- Native or API-based integration with common monitoring platforms
- Ability to auto-create and auto-close incidents based on event state
- CI linkage on every auto-raised ticket
- Suppression rules tied to change records
- Dashboards that show event volume trends over time
The TIKTING service management platform is built to ITIL v4 standards and supports the kind of CI-linked incident creation and change-window suppression that makes event management operationally useful rather than theoretically sound.
Event Management Checklist

Use this checklist to assess the maturity of your current event management practice:
- All services in the service catalogue have corresponding monitored CIs in the CMDB
- Monitoring thresholds are based on observed baselines, not vendor defaults
- Thresholds are reviewed at least quarterly
- Alerts are categorised as informational, warning, or exception before reaching a human
- Correlation rules suppress duplicate and child alerts
- Approved change windows automatically suppress or contextualise alerts
- Exception events auto-create incident tickets with CI reference and diagnostic context
- Warning events create watchlist tasks, not high-priority incidents
- Informational events go to a log store only
- Routing rules are documented and version-controlled
- Post-incident reviews include a check of whether the originating event fired correctly
- Event volume trends are reviewed monthly to identify threshold drift
If you can answer yes to fewer than half of these, your event management process has significant gaps that are likely contributing to both alert fatigue and missed incidents.
Key Takeaways

- Event management is a proactive ITIL v4 practice that detects and filters infrastructure signals before they become user-reported incidents.
- The three event categories — informational, warning, and exception — must be correctly defined and consistently applied to avoid alert fatigue.
- Alert fatigue is a process problem, not a tooling problem. Fixing it requires threshold tuning, correlation rules, and clear routing logic.
- A five-stage process — define, threshold, filter, route, review — gives teams a repeatable structure that improves over time.
- Event management only reaches its potential when integrated with incident management, change management, and a well-maintained CMDB.
- Odysseus asset discovery helps keep your CMDB current so that every monitored CI has an accurate, up-to-date record to link against when events fire.
- The TIKTING service management platform connects event-driven incident creation to the full ITSM workflow, so nothing that fires in monitoring falls through the cracks.
The goal is not zero alerts. It is the right alerts reaching the right people with enough context to act — before users ever notice something is wrong.